Metrics
Metrics is a tool that monitors system performance. We use Prometheus for our system.
Deploying Prometheus
If you are running an IOST node, and wouuld like to look up the metrics of the node, follow these steps:
- Run prometheus
pushgateway
docker run -d -p 9091:9091 prom/pushgateway
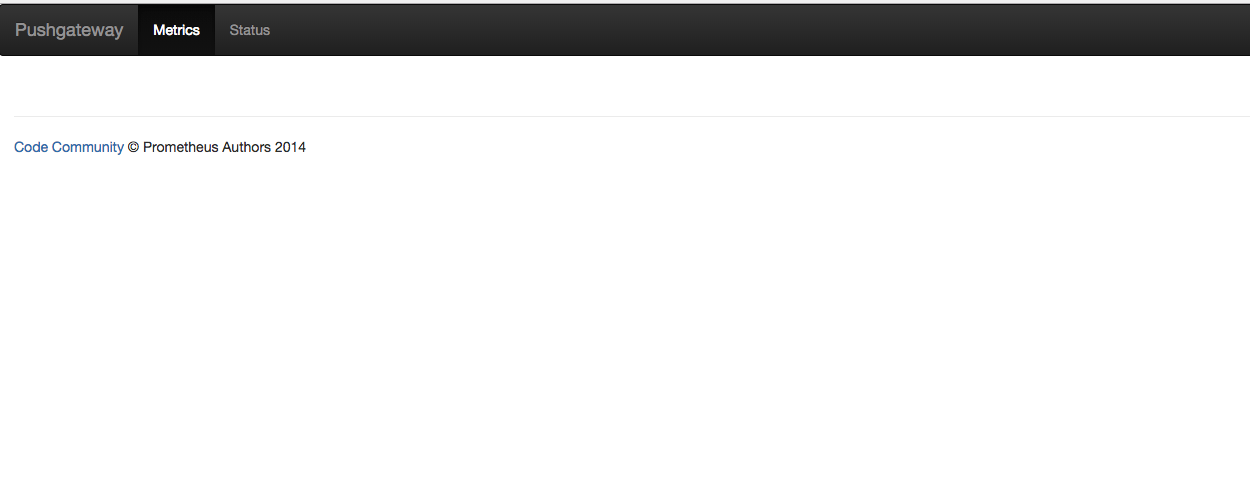
After installation, go to [pushgateway_ip]:9091 in your browser and you can see the following page ([pushgateway] is the IP the docker is deployed to):
- Run prometheus server
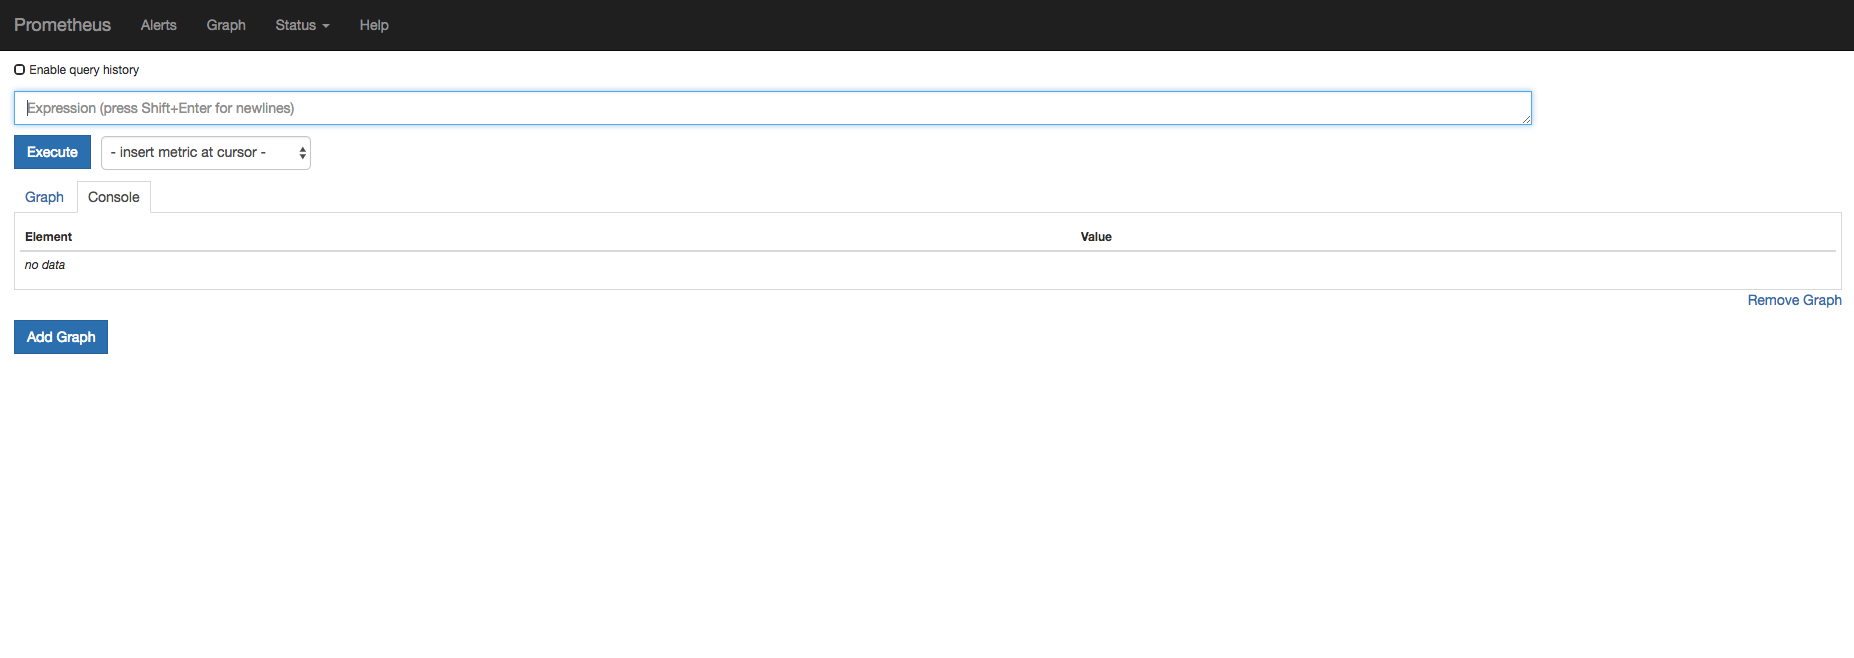
docker run -d -p 9090:9090 -v /tmp/prometheus.yml:/etc/prometheus/prometheus.yml prom/prometheus
- Configure
promethus.yml
global:
  scrape_interval: 15s
  external_labels:
    monitor: 'codelab-monitor'
scrape_configs:
  - job_name: 'prometheus'
    scrape_interval: 5s
    target_groups:
      - targets: ['pushgateway_ip:9090']
Remember to replace pushgateway_ip with the docker's IP address.
- Configure
iserver.yml
metrics:
	pushAddr: "pushgateway_ip:9090"
	username: ""
	password: ""
	enable: true
	id: "defined_by_yourself"
Add the above configuaration to iserver.yml.
Afther the above steps, you can check IOST metrics in "prometheus_ip:9091". The following metrics are provided:
iost_pob_verify_block: Number of verify blocks
iost_pob_confirmed_length: Block height
iost_tx_received_count: Number of transactions received
iost_txpool_size: Number of transactions to pack
iost_p2p_neighbor_count: Number of neighbors
iost_p2p_bytes_out: Bytes sent
iost_p2p_packet_out: Packets sent
iost_p2p_bytes_in: Bytes received
iost_p2p_packet_in: Packets received
Metrics permission validation
If you need to add permission to metrics to avoid others pushing metrics to your system, deploy an nginx instance and add permission control. Refer to the document for specific steps: https://prometheus.io/docs/guides/basic-auth/
After nginx deployment, add a username and a password field to the iserver.yml configuration file.